Gender Representation in Film: Implementing the APT Visualization Algorithm
SIADS 522: Information Visualization I · University of Michigan · October 2025
Project Overview
This project was completed as part of SIADS 522: Information Visualization I at the University of Michigan. The assignment had two components: implementing the Mackinlay APT (A Presentation Tool) algorithm — a classic system for automatically selecting optimal visual encodings for a given set of variables — and applying it to analyze gender representation in the top 20 grossing films of 2016 alongside their Bechdel Test results.
The APT algorithm formalizes something visualization practitioners do intuitively: given a set of variables and their data types, which visual channels (position, color, shape, size) should be assigned to which variables, and in what order? Implementing it from scratch required translating the algorithm's ranked encoding preferences into a functioning Python system, handling conflicts between channels that map to the same underlying Altair property, and surfacing useful exceptions when valid encodings can't be found.
Skills demonstrated in this project
The APT Algorithm
First described by Jock Mackinlay in 1986, APT formalizes the process of selecting visual encodings by ranking channels in order of effectiveness for each data type. For quantitative variables, position (x, y) is most effective; color density and hue are less so. For nominal variables, the preference order shifts — hue becomes more appropriate, and size less so. The algorithm works by assigning the highest-ranked available channel to the most important variable, then iterating through remaining variables and channels until all are assigned or a conflict is raised.
The implementation required two core functions. The first, selectEncodings(), accepts an ordered list of variables with their types and returns each variable paired with its assigned encoding channel. The second, generateAPTVis(), takes those assignments and builds a working Altair chart by iterating through the encoded variables and layering each channel incrementally.
Several non-trivial design decisions were required beyond the basic algorithm. Altair's Point mark doesn't support all APT channels (volume, texture, connection, and containment have no equivalent), so those were excluded with documented justification. Color density, saturation, and hue all map to Altair's single Color channel — meaning only one can be used per chart, and the others must be blocked once one is assigned. The implementation surfaces a custom EncodingException with a descriptive message when no valid encoding can be found for a variable.
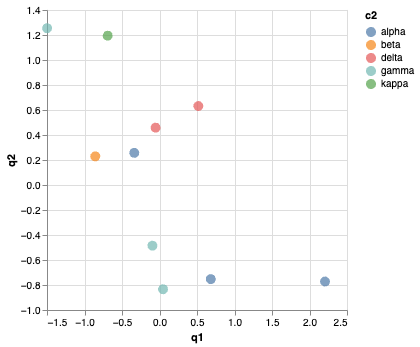
Example encoding assignments produced by the algorithm:
| Variable | Type | Assigned Encoding |
|---|---|---|
| q1 (quantitative) | Q | x-position |
| q2 (quantitative) | Q | y-position |
| c2 (nominal) | N | hue (color) |
The Data
The dataset was derived from FiveThirtyEight's Next Bechdel project, combining three sources: Bechdel Test pass/fail results for the top 50 grossing films of 2016, cast gender breakdowns by role type (lead, supporting, ensemble), and domestic box office figures. The combined dataset covers the top 20 films, with one row per movie-role type-gender combination — allowing analysis of both how films performed commercially and how they were staffed on screen.
The Bechdel Test is a simple but widely-cited measure of gender representation in film: a movie passes if it features at least two named women who speak to each other about something other than a man. While a low bar, pass rates across mainstream Hollywood releases are often lower than expected.
Visualization Outputs
Beyond the APT implementation, the assignment involved building a series of Altair visualizations using the Bechdel dataset — including a dumbbell plot comparing male and female cast counts by role type and movie, a stacked bar chart of female cast composition by film, and a combined three-panel view pairing male/female cast counts with Bechdel pass/fail status and box office rank.
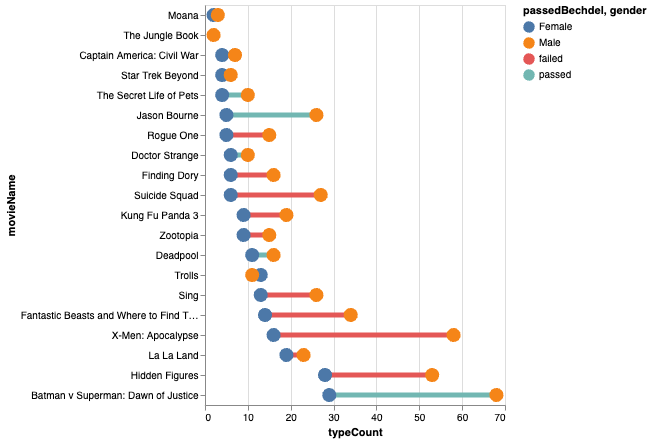
Male vs. Female Cast Count by Role Type
A ranged dot plot connecting male and female actor counts for each film, colored by Bechdel pass/fail status. The range line makes the gap between genders immediately visible, and the color encoding layers in whether the film met even the minimum representation threshold.
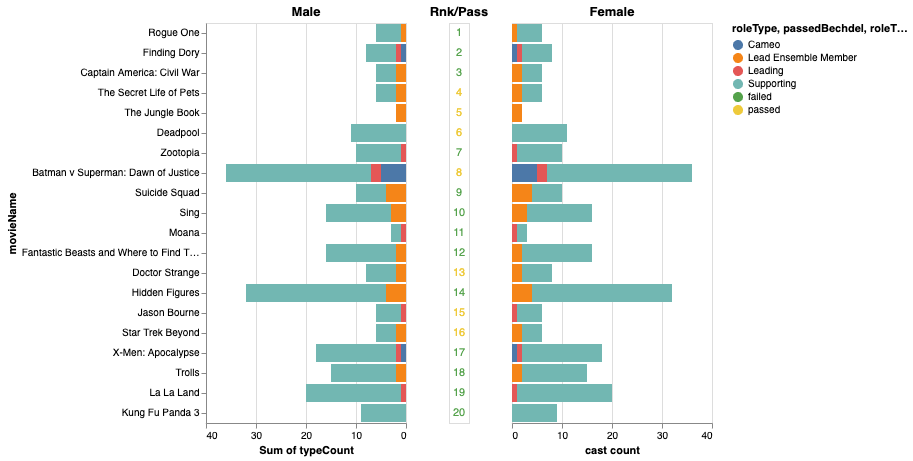
Cast Composition, Rank, and Bechdel Status
A three-panel compound chart showing male cast counts, female cast counts, and box office rank side by side — with Bechdel pass/fail color-encoded in the center panel. Laying these views out together allows direct comparison across all three dimensions for each film without switching between charts.
Key Insights
- Encoding selection is a solvable problem — with constraints. The APT algorithm works cleanly for most variable combinations, but real implementation surfaces meaningful edge cases: channels that conflict, marks that don't support certain encodings, and situations where the algorithm simply runs out of valid options. Handling these gracefully — with informative exceptions rather than silent failures — is as important as the algorithm itself.
- Gender gaps in cast composition are visible across most films. Across the top 20 films of 2016, male cast members consistently outnumber female cast members in supporting and ensemble roles. The gap is widest in films that failed the Bechdel Test, but even several passing films showed significant imbalances in total cast composition.
- Box office performance shows no consistent relationship with Bechdel results. High-grossing films appear on both sides of the Bechdel pass/fail divide. The data doesn't support the claim that representation comes at a commercial cost — nor that it drives commercial success.